
Monitoring tools#
Model parametrization is usually a tricky part. In order to facilitate the monitoring of CWatM model parametrization, we provide a graphical visualization tool named plot_timeseries.py. As this tool is only remotely connected to GEOP4TH, it is not intended to be imported as other modules. Instead, you can find it in the geop4th/src/misc/cwatm folder.
This tool generates a figure based on parameters passed in an associated settings.yaml file (Note: the path to this .yaml file has to be specified in plot_timeseries.py). An example of such a settings.yaml file is provided in the same folder as plot_timeseries.py.
Note
Automatic definition of locations
If the parameter coords_data: 'auto' is specified, it is required to pass a gauge_vector filepath
pointing to a vector file containing all desired gauge points as well as quantity timeseries for each point.
For instance, for discharge data in France, such a file can be automatically generated by using the following function in the IDE:
from geop4th import (
    download_fr as dl,
    standardize_fr as stz,
)

dl.hydrometry(
    dst_folder = <r"Path/to/output/folder">,
    masks = <mask variable or r"Path/to/mask/file">,
    filetypes = 'geojson',
    start_year = <2000>,
    end_year = <2025>
    )

ds = stz.hydrometry(
    <r"Path/to/previously/downloaded/files">
    )

geo.export(ds, <r"Filepath/to/result/file.json">)

# This resulting file can be used as the ``gauge_vector``.
Study Case: Pays Basque#
Discharge gauge stations#
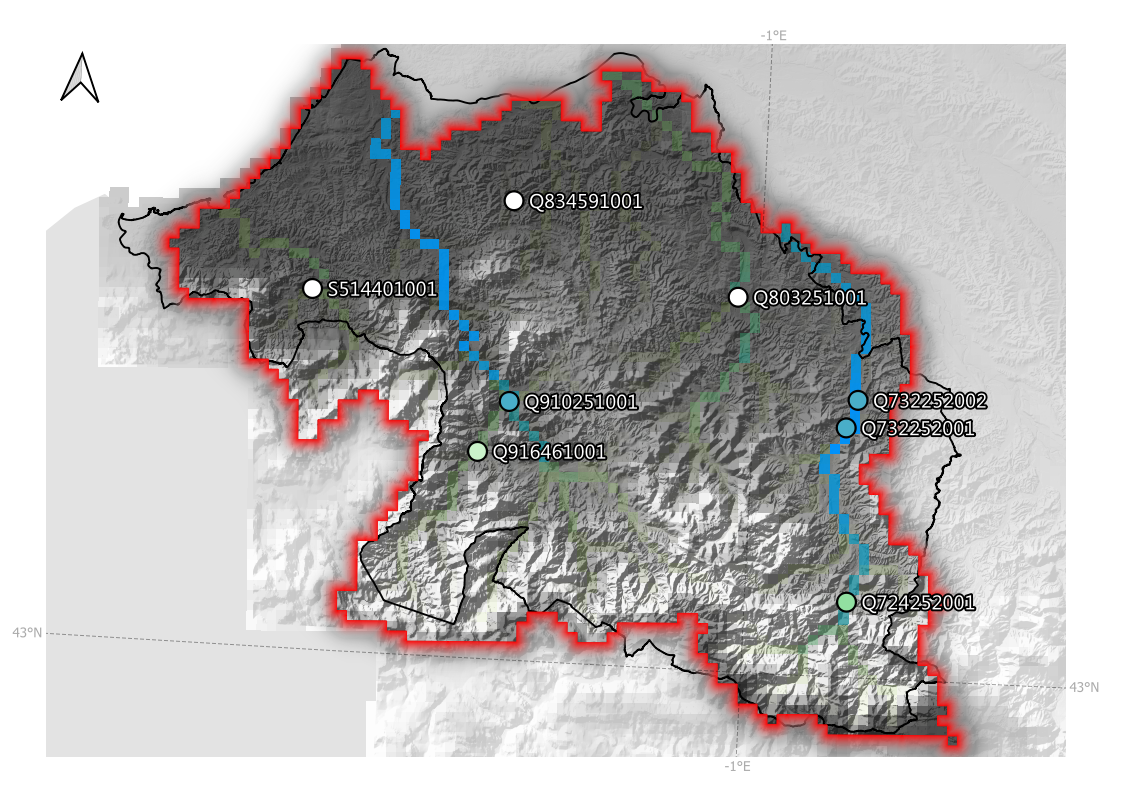
Locations of gauge stations#
Data are from HydroPortail (API Hub’Eau).
Discharge monitoring#
